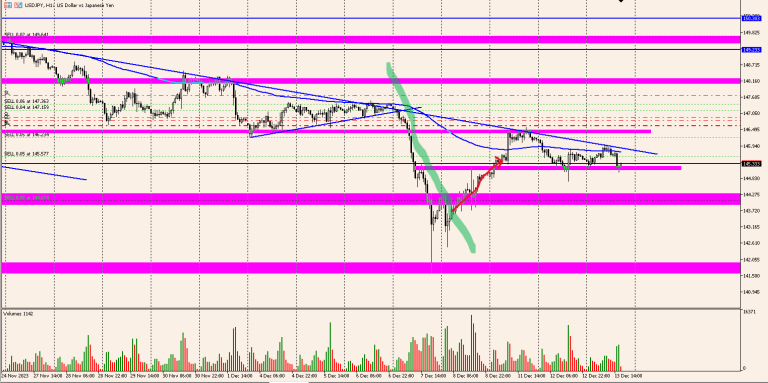
Indicators
iMy
In the graphical representation, techanalysis represents the trend line to the right of the candles on the breakdown (in green).…
Browse indicators for MetaTrader with source code and screenshots
In the graphical representation, techanalysis represents the trend line to the right of the candles on the breakdown (in green).…
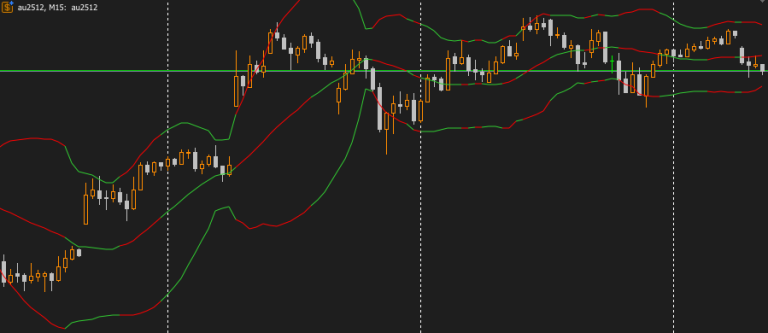
A simple indicator based on Bollinger Bands showing its narrowing and widening phases with red/green colours.
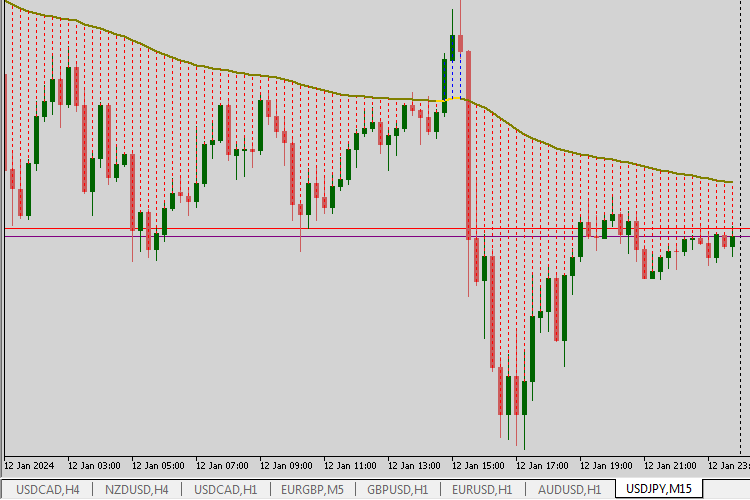
The indicator is written by request on the forum.
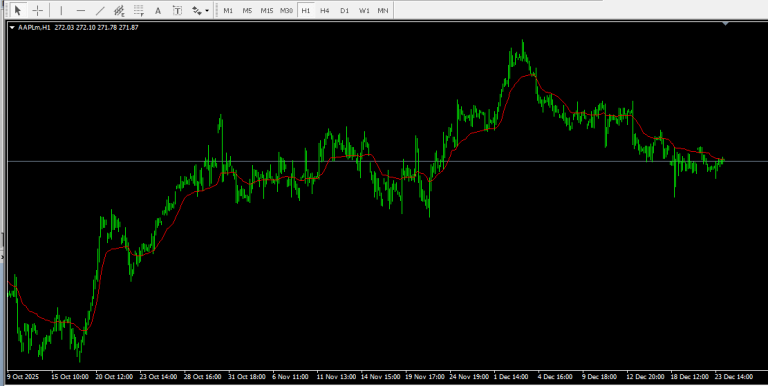
VIDyA is only available by default in mt5, here is it's mt4 equivalent. Note if using it with an EA…
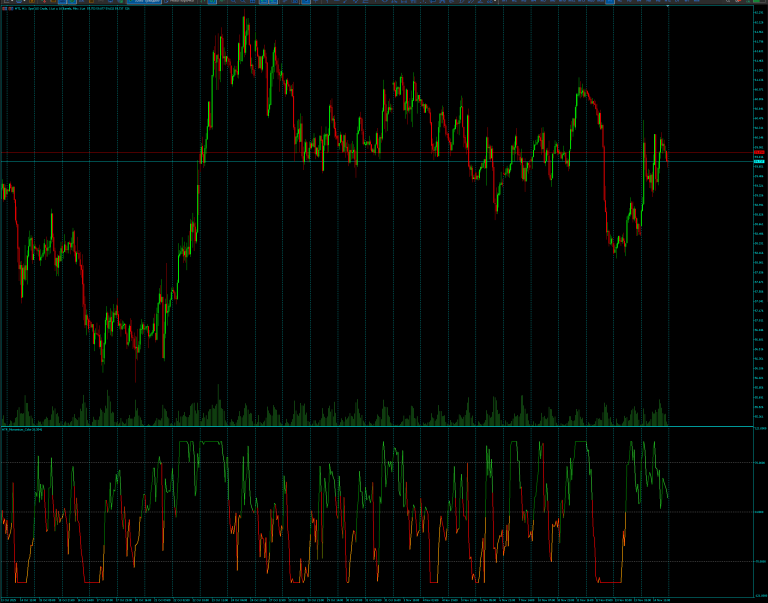
combination of many familiar indicators for beginner traders
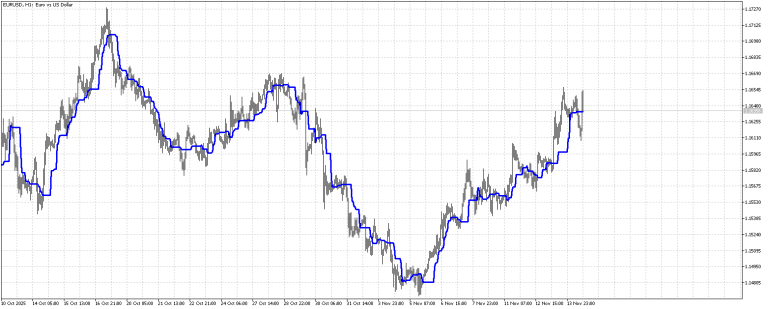
The indicator implements one of the non-linear smoothing algorithms
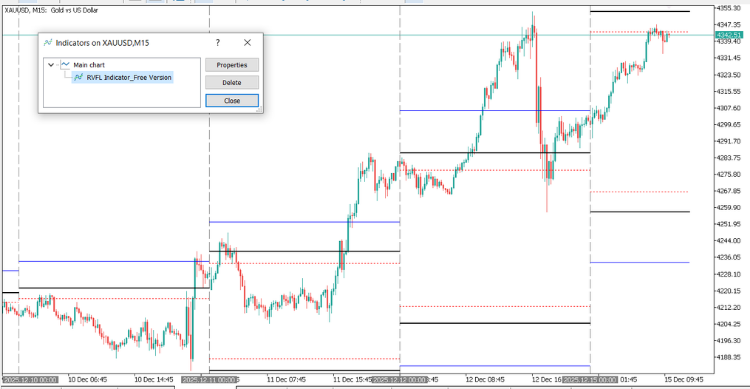
A professional visual indicator for the popular "One Candle" Daily Breakout strategy (0.9 SL / 1.25 TP). Automates the vector…
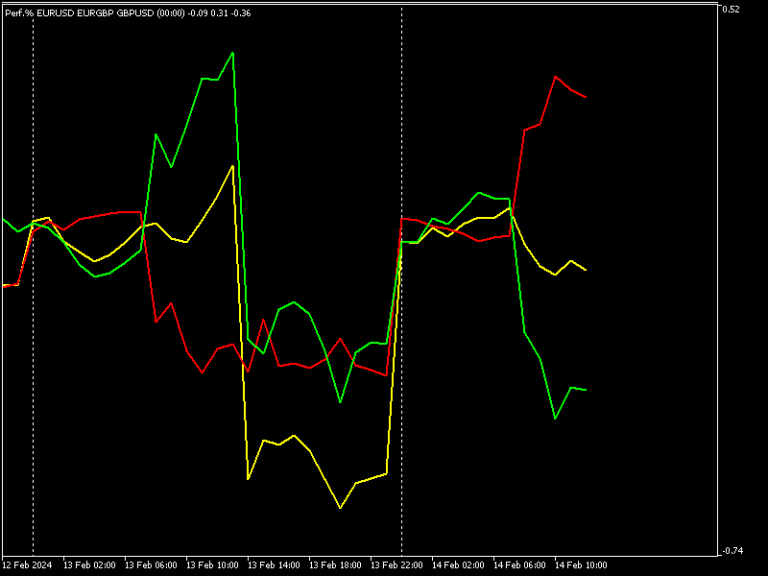
Set three crosses and monitor the daily percentage performance starting from a given time (that can also be set).
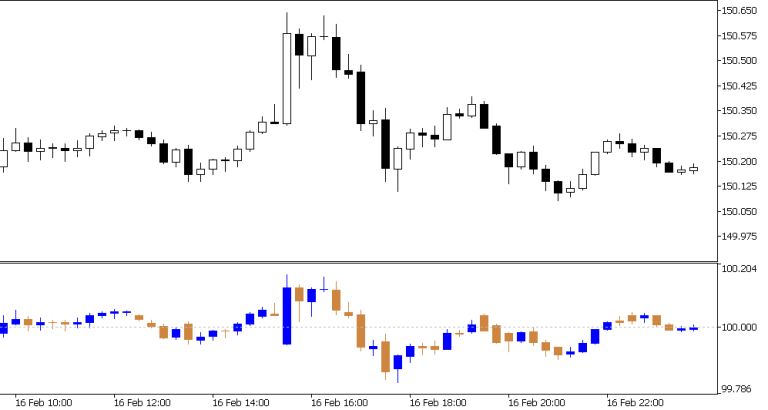
Idea by Andrey F. Zelinsky, based on an indicator by William Blau
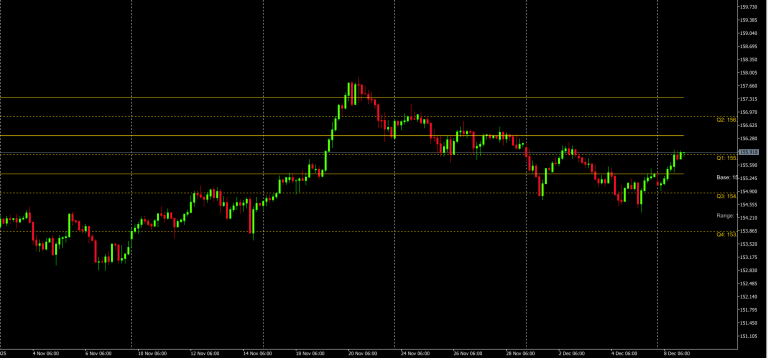
This indicator implements the "Quarters Theory" - a technical analysis concept that divides price movement into four quarters around a…