Session Range Breakout: Asia, London and New York high/low levels
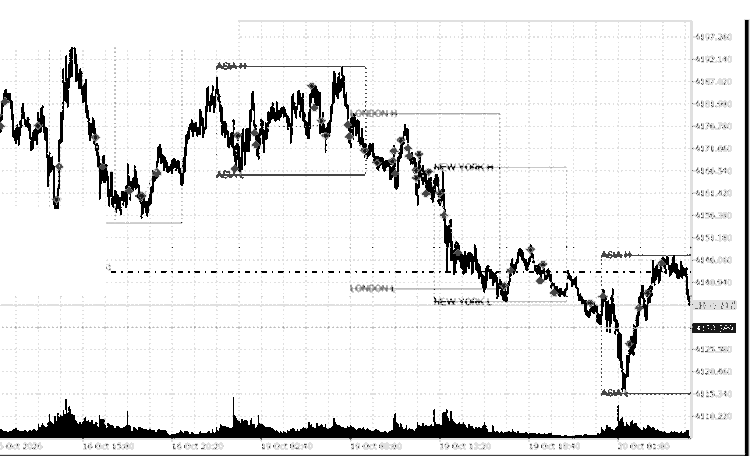
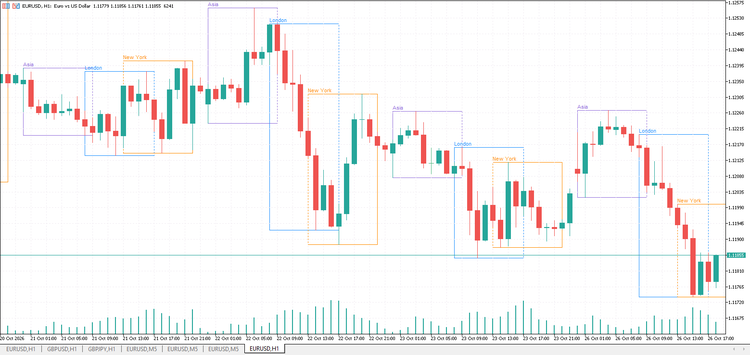
Session Range Breakout plots the high and low of up to three configurable intraday sessions and extends both levels to the right, so the range stays visible after the session closes.
HOW IT WORKS
– Each session is defined by a start hour (inclusive) and an end hour (exclusive), in server time.
– While a session is open the indicator tracks its running high and low.
– When the session closes, the two levels are drawn as dotted lines with optional NAME H / NAME L labels and a thin range rectangle.
– The levels are never recalculated afterwards, so the drawing does not repaint.
INPUTS
– Three sessions, each with on/off, display name, start hour, end hour and colour.
– Bars to scan (0 = full history), extension length in bars, line width.
– Show labels, show range rectangle.
– Alerts: popup, sound and push, fired when a bar closes outside a session range.
– Auto zoom: optionally scales the chart on load so recently closed ranges stay visible.
SUGGESTED USE
Treat the session high/low as reference levels: a close above the range high marks bullish intent for that session, a close below the range low marks bearish intent. The width of the range is also a useful volatility gauge – a narrow range means an intraday move can turn into a breakout quickly.
The indicator draws chart objects only. It does not open, modify or close any trades.