RSI Timeframe Analyzer
A powerful multi-timeframe RSI dashboard that visually displays the overbought, oversold, and neutral RSI status across 9 different timeframes — from M1 to MN1.
A powerful multi-timeframe RSI dashboard that visually displays the overbought, oversold, and neutral RSI status across 9 different timeframes — from M1 to MN1.
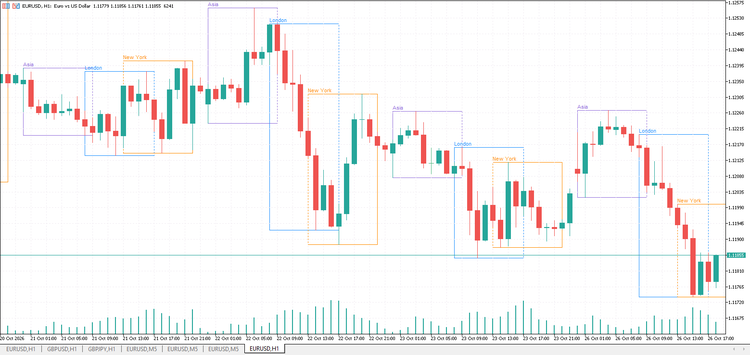
Draws Asia, London and New York session boxes on the chart with each session's high and low.
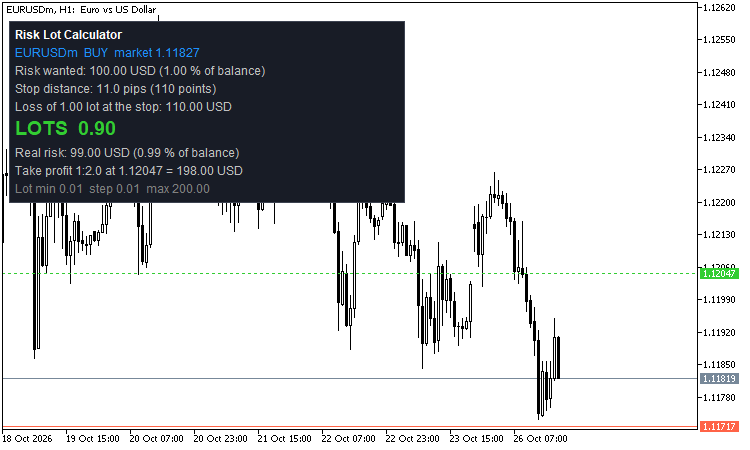
Drag the stop-loss line and read the lot size that risks exactly your money or percent. The CRiskSizer class does…
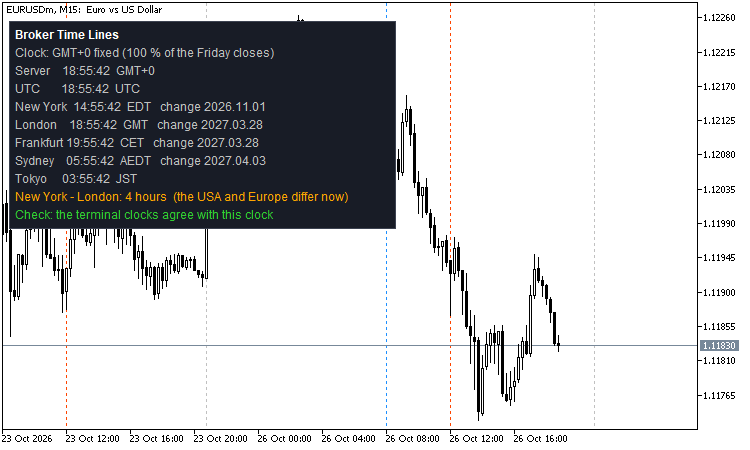
CBrokerTime converts server time, UTC, New York, London, Sydney and Tokyo with the real summer time of every year and…
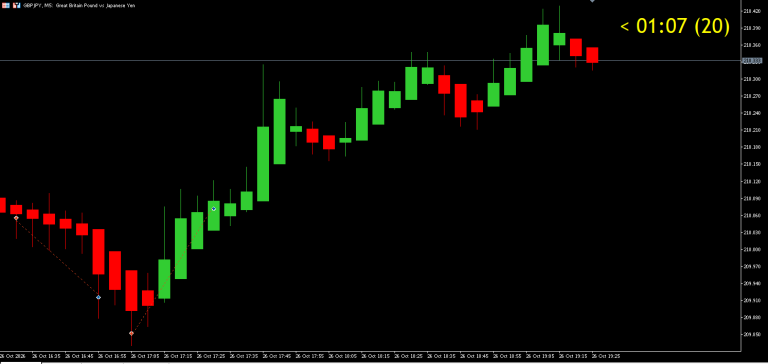
A clean Heikin Ashi indicator that draws on the main chart window. It also adds one horizontal line at the…