Institutional DXY Overlay and Correlation Divergence
In quantitative and institutional trading, no asset moves in a vacuum. The US Dollar Index (DXY) is the primary driver of global liquidity. Professional traders use Intermarket Analysis to spot “SMT Divergences” — situations where the correlation between the DXY and its counterparts (like EURUSD, GBPUSD, or Gold) breaks down, signaling an imminent institutional reversal.
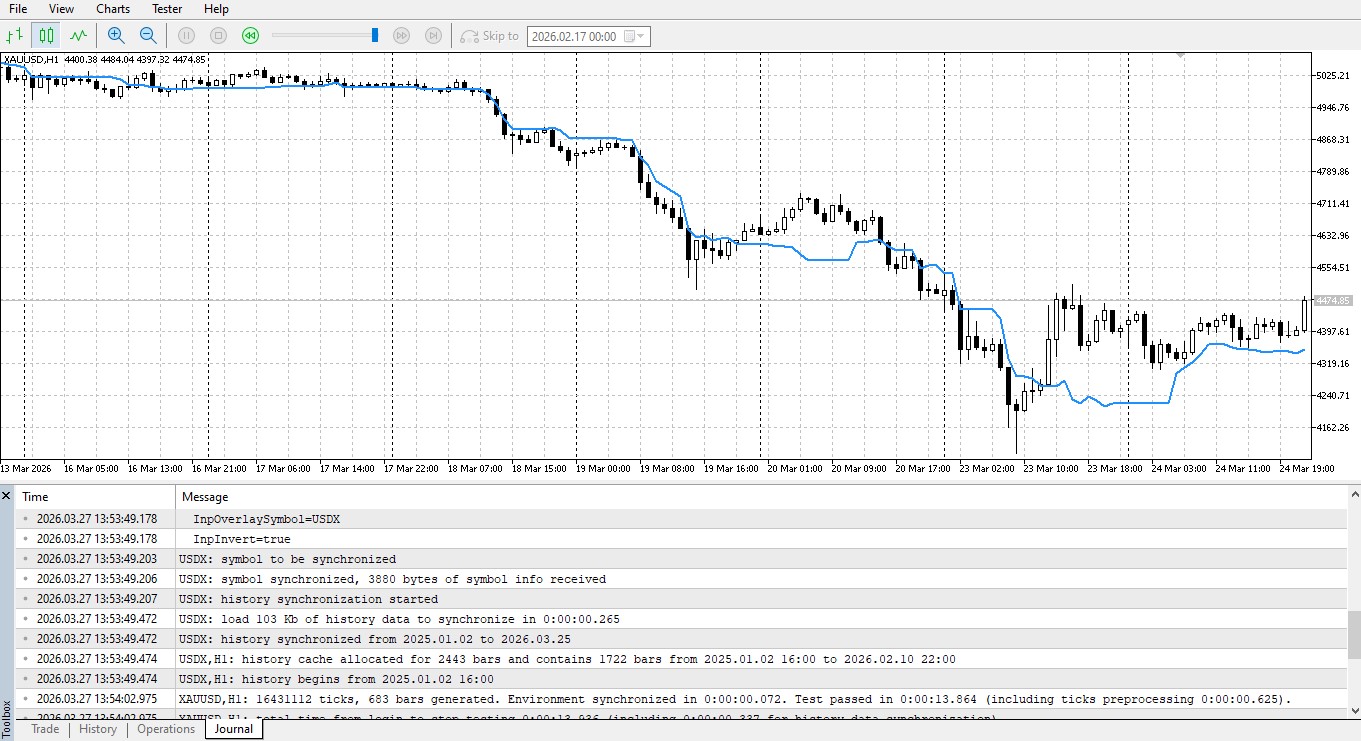
The Institutional DXY Overlay is a high-performance utility that synchronizes and plots the Dollar Index directly on your trading chart. This allows for immediate visual confirmation of Smart Money footprints without switching windows.
Key Technical Features
-
Multi-Symbol Synchronization: Uses advanced iClose requests to pull data from a secondary symbol (default: DXY or USDX) and aligns it perfectly with the primary chart’s timeframes.
-
Dynamic Scaling: Automatically adjusts the overlay scale to fit your current price action, ensuring the correlation is visually intuitive regardless of price magnitude differences.
-
SMT Divergence Spotter: Essential for identifying when the DXY makes a Higher High while the correlated pair fails to make a Lower Low (a classic sign of institutional accumulation).
-
Optimized Engine: Built with efficient data polling to ensure zero impact on terminal latency, even when scanning deep historical data.
Input Parameters
-
OverlaySymbol: The symbol to overlay (Default: “DXY” or “USDX”).
-
LineColor / LineWidth: Fully customizable visual appearance.
-
InvertCorrelation: Toggle to mirror the symbol (useful for EURUSD vs DXY).