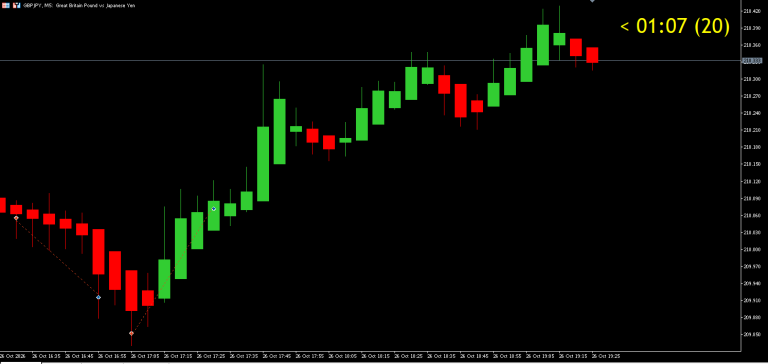
HTF Candles (ICT Power of Three) – higher timeframe candles next to your chart
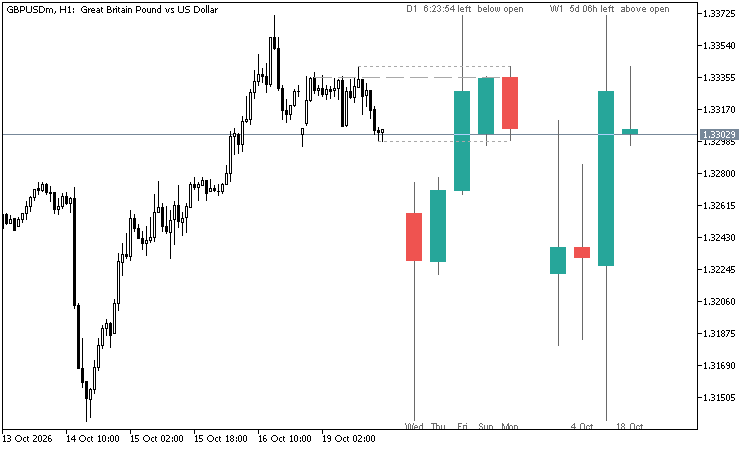
ICT’s Power of Three reads every candle as accumulation near the open, manipulation away from it and distribution in the real direction. To see it you need the higher timeframe candle while you trade the lower one. This indicator draws those candles next to your chart at their real prices, so you can watch the 4-hour or daily candle form on a 5- or 15-minute chart.
What it shows
- The last finished candles and the live candle of one or two higher timeframes, to the right of the last bar.
- Auto pairs (or choose your own): M1 -> M15 + H1, M5 -> H1 + H4, M15 / M30 -> H4 + D1, H1 -> D1 + W1, H4 -> W1 + MN, D1 -> MN.
- Above each set: the timeframe, the time left until the live candle closes, and whether price is above or below its open.
- Live candle: dashed lines from its open, high and low back to the chart candle where each one was made.
- The time under each candle (08:00, Mon, 18 Oct, Oct). Labels are skipped when they would overlap.
- Hover a candle to see its open, high, low and close.
- Optional: the previous candle’s high and low on the chart.
How it works
- The candles are built from the chart’s own candles: open of the first, close of the last, highest high, lowest low. No data of another timeframe has to be loaded. Compared with the broker’s own H4, D1, W1 and MN candles: identical.
- Server time: H1 – H12 from the start of the hour, D1 from 00:00, W1 from Sunday, MN from the 1st.
- Candle width and gap are set in pixels, so the candles keep their size when you zoom.
- Chart shift is turned on and widened when the candles need room (input). Your old setting comes back when you remove the indicator.
Alerts
- A new candle of the first higher timeframe.
- A candle closes across the open of that higher timeframe candle.
- Popup, push notification and e-mail.
Buffers for Expert Advisors (first higher timeframe, iCustom, not drawn)
- 0 / 1 / 2: open, high and low of the higher timeframe candle so far (up to and including this chart candle, no look-ahead)
- 3 / 4 / 5: high, low and close of the previous higher timeframe candle
- EMPTY_VALUE when there is none
Example: the last close above buffer 0 = price above the daily open, a common ICT bias filter.
Good to know
- The chart time frame must be D1 or lower and must divide the higher one.
- The indicator only draws and calculates; it never trades.