Failed Breakout Detector
Failed Breakout Detector marks the breakouts of the recent trading range and, more important, the breakouts that fail. It is a small price action tool: it does not predict anything, it only shows where the traders who chased a breakout got trapped.
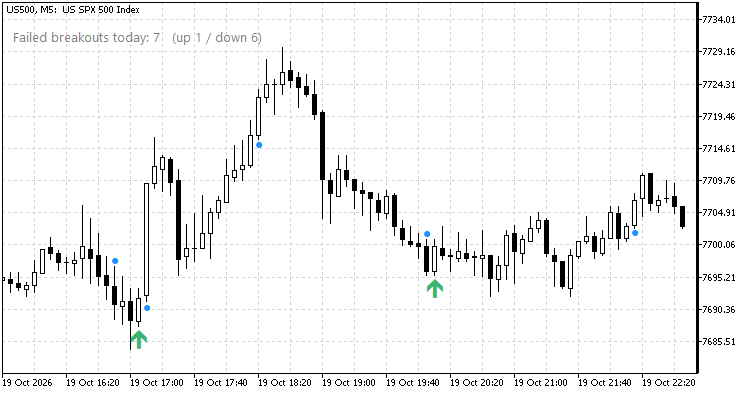
US500 M5: a failed breakout down (green arrow) at 17:00, the trapped sellers fuel the rally that follows. Blue dots mark the breakout bars.
How it reads the chart
- The range is the highest high and the lowest low of the last N bars (default 12).
- A bar that closes outside that range, by at least a small ATR-based buffer, is a breakout. It is marked with a small blue dot.
- If one of the next K bars (default 3) closes back inside the range, the breakout has failed. A failed breakout up is marked with a red arrow above the bar, a failed breakout down with a green arrow below the bar.
- If price holds outside the range for K bars, the breakout is confirmed and nothing more is drawn.
- A label in the chart corner counts the failed breakouts of the current day (up / down).
Why failed breakouts matter
Traders who bought a breakout up and then see a bar close back inside the range are trapped. They have to get out, and their selling often starts a move the other way. The same holds for a failed breakout down. On a range day the failed breakouts are the places to fade the edges; on a trend day they are rare, which is a useful piece of information on its own.
Everything is calculated on closed bars only, so nothing repaints. The range is filtered by its height (between 0.5 and 4 ATR by default), so very tight and very wide ranges are ignored. Only one breakout is tracked at a time: the next breakout is looked for once the previous one has failed or has been confirmed.
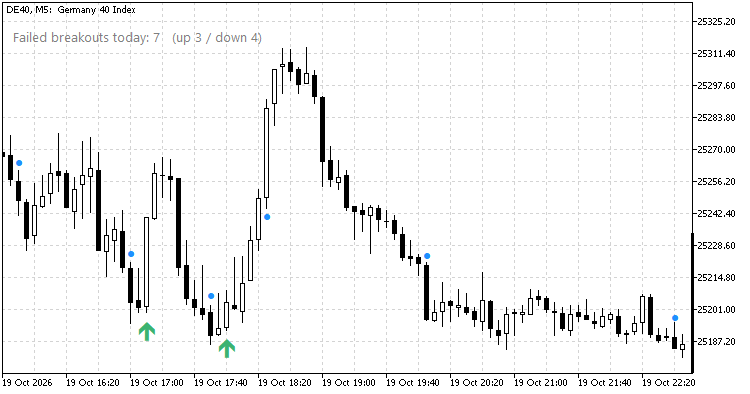
DE40 M5: two failed breakouts down (17:00 and 17:50) at the low of the afternoon, then the rally to the day high. The label counts the failed breakouts of the day.
Input parameters
- Bars that form the range (12)
- Bars in which the breakout must hold or it has failed (3)
- ATR period (14), used to filter the range height
- Minimum / maximum range height, in ATR (0.5 / 4.0)
- Close must be this far beyond the range, in ATR (0.1)
- Show the breakout dots (true)
- Show the “failed breakouts today” label (true), its corner, X / Y offset, font size and colour
- Alerts on a failed breakout: pop-up, push notification, sound (all off by default)
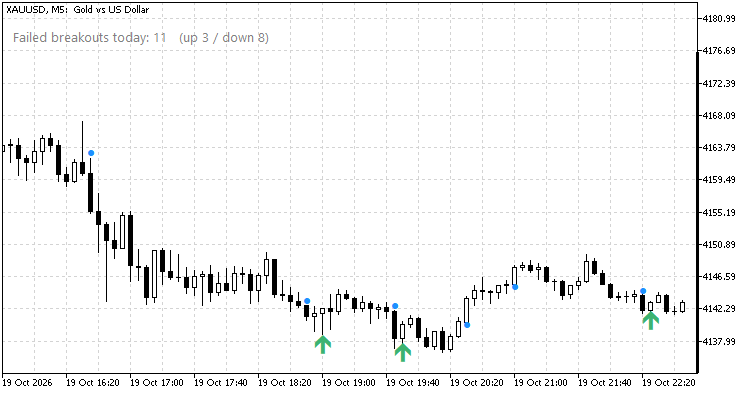
XAUUSD M5: three failed breakouts down on a slow slide, each one followed by a bounce.
Buffers (for an Expert Advisor via iCustom; the value is 0 where there is no signal)
- 0 – breakout up (price of the dot), 1 – breakout down
- 2 – failed breakout up (bearish), 3 – failed breakout down (bullish)
- 4 – signal: +1 failed breakout down (bullish), -1 failed breakout up (bearish), 0 nothing
- 5 – number of failed breakouts on the bar’s day, so far
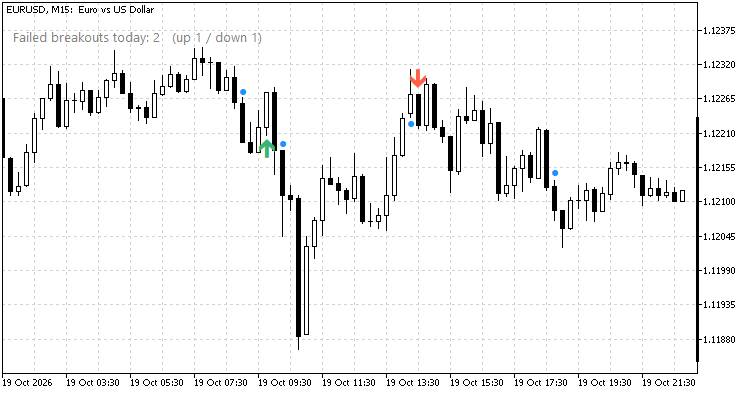
EURUSD M15: works on forex too. One failed breakout down (09:30) and one failed breakout up (13:30, red arrow), which was followed by the sell-off.
Notes
- Works on any symbol and timeframe. It was written for intraday index trading on M5 (DAX, US500).
- The screenshots were taken on 19 October 2026 in the black-on-white chart scheme.
- The failed-breakout logic is one of the building blocks of the author’s Market State Reader indicator.