VSA Glossary
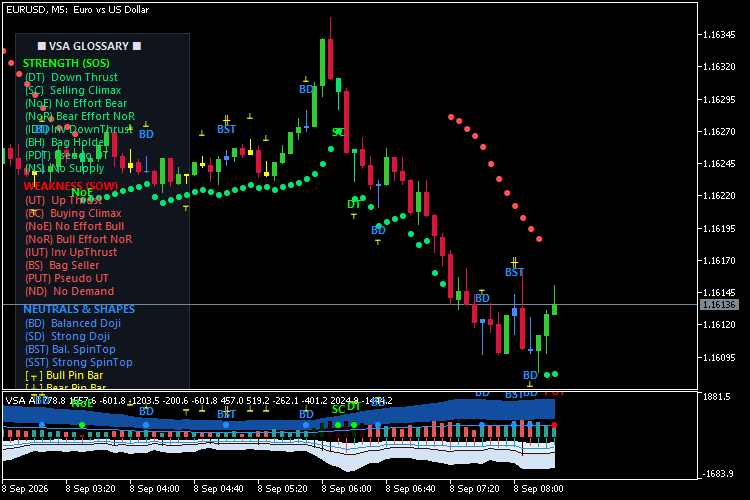
Key Features1. Main Chart Window (VSA_Candles.mq5)
-
Native Candlestick Color Coding: Direct bar coloring on the main chart based on institutional volume confirmation:
-
Green (SOS): Confirmed Sign of Strength (e.g., Down Thrust / Spring, Selling Climax, Bag Holder, No Supply).
-
Red (SOW): Confirmed Sign of Weakness (e.g., Up Thrust, Buying Climax, Bag Seller, No Demand).
-
Blue (Neutral): Dojis and Spinning Tops showing equilibrium / consolidation.
-
Yellow (Pure Shapes): Classic price action patterns without volume extremes.
-
-
VSA SAR-Style Dynamic Trend Dots: Trailing stop/trend dots that trail like a Parabolic SAR but dynamically flip, tighten, or accelerate based on institutional buying and selling exhaustion.
-
Hover Tooltips (Closed Bars Only): Hovering over any signal label displays institutional context (bar time, exact volume vs. MA multiplier, spread, and expected market reaction).
-
Left-Side Tower Glossary: A vertical on-chart HUD displaying every pattern’s short and full name.
2. Sub window Display (VSA_Glossary.mq5)
-
Dual-Direction Layout:
-
Volume Bars: Color-graded columns rising upward from zero with dark blue High-to-Ultra background fill clouds.
-
Spread Bars: Inverted range lines projecting downward from zero with light ice-blue fill clouds, auto-scaled to volume.
-
-
Baseline Signal Dots: Visual markers plotted along the zero line to indicate signal types at a glance.
-
Live Bar Forecaster Badges: Dynamic teal pill tags anchored ~1 inch from the live candle displaying elapsed bar time percentage and projected volume/spread vs. the active Moving Average.