Volume-Weighted Delta Divergence Oscillator
Volume-Weighted Delta Divergence Oscillator
Volume-Weighted Delta Divergence Oscillator
Author: Adeolu Gbadebo
The idea behind it
Most retail platforms don’t expose real order-flow data, but a bar’s own shape already tells you where volume was concentrated. If a candle closes near its high, buying pressure likely dominated that bar; if it closes near its low, selling pressure did. The indicator turns this into a per-bar delta proxy: it takes the position of the close within the bar’s high-low range, converts that into a ratio between -1 and +1, and multiplies it by that bar’s volume (tick volume or real volume, selectable). Bars with a wide range and a close near the extreme, on strong volume, produce a large delta reading in either direction.
Those per-bar deltas are then summed over a rolling window (InpDeltaPeriod) to build a cumulative delta line, and that line is normalized by its own recent standard deviation (InpNormPeriod) so the oscillator reads on a comparable scale across symbols and volatility regimes, rather than as a raw, unbounded volume figure. A short moving average (InpSmoothPeriod) removes bar-to-bar noise before the value is plotted. On top of that oscillator, the indicator scans for confirmed swing highs and lows in price (using a symmetric fractal-style window, InpDivLookback bars on each side) and compares each new swing against the most recent prior swing of the same type. If price prints a higher high while the oscillator prints a lower high, that’s regular bearish divergence — buying pressure is fading even as price pushes higher. The mirror case, a lower low in price against a higher low in the oscillator, is regular bullish divergence. Best used on EURUSD, GBPUSD, and other liquid pairs on the M15 to H4 charts, where tick volume is a reasonably dense proxy for real trading activity.
How to interpret it
- VWDD Oscillator histogram — the main two-tone histogram in the subwindow. Bars above the zero line (lighter shade) indicate net buying pressure has dominated recently; bars below zero (darker shade) indicate net selling pressure. The further from zero, the more one-sided the recent order flow has been relative to its own history.
- Normalization method — the raw cumulative delta is divided by its rolling standard deviation, producing a z-score-like reading. This keeps the oscillator’s scale stable across instruments and sessions instead of drifting with average volume levels.
- Divergence arrows — an upward arrow beneath the histogram marks a confirmed bullish divergence (price low undercut, oscillator low did not); a downward arrow above the histogram marks a confirmed bearish divergence (price high exceeded, oscillator high did not). Because swing confirmation needs bars on both sides, arrows appear with a lag of roughly InpDivLookback bars after the actual swing bar — this is a trade-off for reliability, not a bug.
- Practical usage — treat divergence arrows as an early warning to tighten stops or start scaling out of a position in the direction of the existing trend, not as a standalone reversal entry signal. Combine with a structure break, a trendline violation, or a lower-timeframe confirmation candle before entering counter-trend. Sustained histogram readings on one side of zero, without divergence, can also be used as trend-continuation confirmation.
External variables (inputs)
| Input | Default | Purpose |
|---|---|---|
| InpDeltaPeriod | 20 | Number of bars summed into the rolling cumulative volume delta. |
| InpNormPeriod | 50 | Lookback used to compute the standard deviation that normalizes the cumulative delta into a z-score-style reading. |
| InpSmoothPeriod | 5 | Simple-average smoothing period applied to the normalized oscillator before it is plotted. |
| InpVolumeType | Tick volume | Selects tick volume or real volume (where the feed provides it) as the weighting factor for the per-bar delta. |
| InpDivLookback | 10 | Bars required on each side of a candidate bar to confirm it as a swing high or swing low. |
| InpDivSearchRange | 100 | Maximum number of bars searched backward for a prior swing point when checking for divergence. |
| InpShowArrows | true | Enables or disables plotting of the bullish/bearish divergence arrows. |
| InpArrowOffset | 0.30 | Vertical distance, in oscillator units, between a divergence arrow and the histogram it marks. |
Recommended use
Load the indicator in its own subwindow beneath the price chart. Start with the default settings on M15–H1 charts of major FX pairs, where volume is reasonably continuous; on thinly traded symbols, consider lengthening InpNormPeriod so the normalization isn’t skewed by a handful of unusually quiet bars. When a divergence arrow appears, check the higher timeframe trend first — divergence against the dominant trend is best treated as a caution flag rather than an automatic reversal trade. Pairing the oscillator with a simple structure or support/resistance template keeps false signals from choppy, low-volume periods to a minimum.
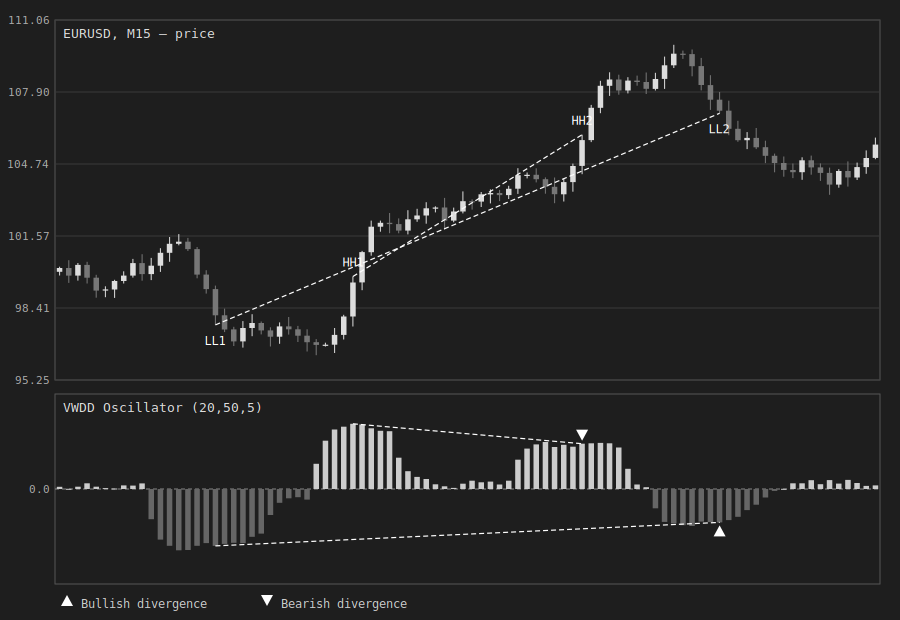
Fig. 1. VWDD Oscillator in its subwindow beneath price. The two-tone histogram shows accumulated, normalized buy/sell pressure; dashed lines connect the compared swing pairs, with a downward arrow flagging bearish divergence at the second price high and an upward arrow flagging bullish divergence at the second price low.